
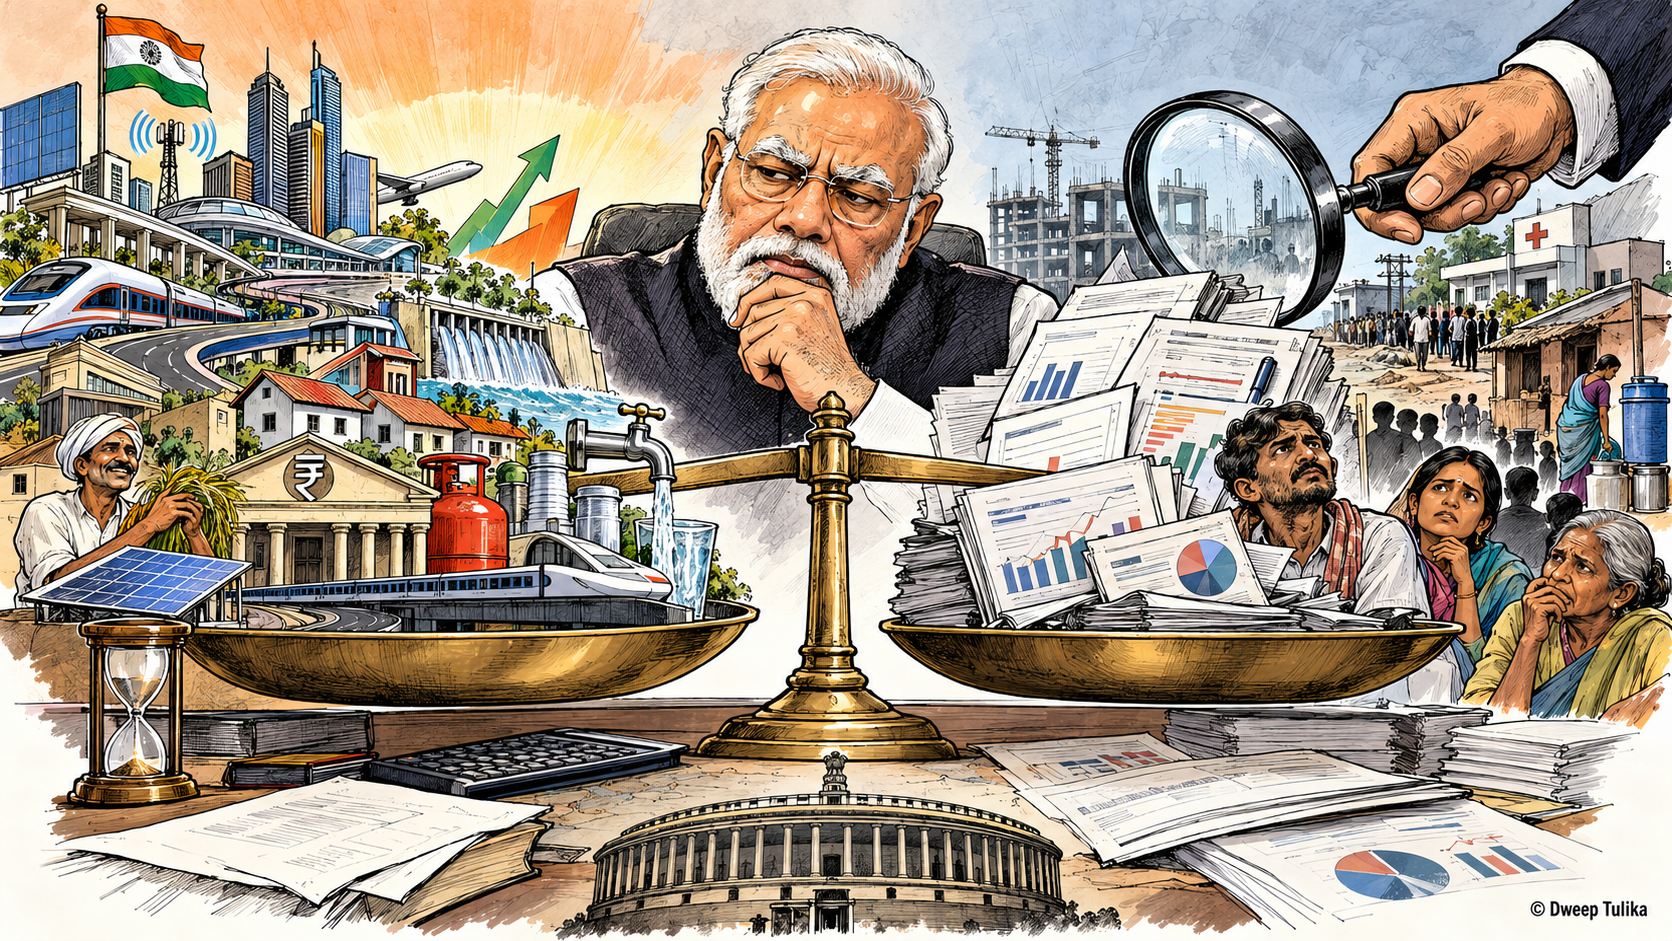
THE HEADLINE PRIME MINISTER | PART 1 OF 7
What was promised, what was delivered, who benefited, and what does the evidence reveal?
By Dweep Tulika | Investigative Editorial
Twelve years, one central question
On 9 June 2026, Prime Minister Narendra Modi highlighted 12 years of his government's record in development, public welfare, infrastructure and digital transformation. The government presented this period as one of expanded opportunities, improved public services and greater access to welfare schemes.
Since May 2014, the Union government has introduced new programmes, expanded existing initiatives and invested in infrastructure and digital services. Many of these developments have affected millions of households.
But how should these achievements be measured?
A bank account opened is not necessarily an actively used account. A house sanctioned is not necessarily a completed and occupied house. A tap connection does not guarantee a reliable supply of safe drinking water. And a decline in the unemployment rate does not, by itself, establish that workers have secure jobs or adequate incomes.
These distinctions form the starting point of Dweep Tulika's seven-part investigative editorial series, The Headline Prime Minister.
The objective is straightforward: examine the government's claims against published statistics, audit reports and independent research; identify who benefited; and establish what the available evidence can—and cannot—prove.
The investigation will neither presume that official claims are false nor treat government announcements as conclusive evidence of success.
1. Financial inclusion: Millions of accounts, but what changed?
The Pradhan Mantri Jan Dhan Yojana (PMJDY), launched in August 2014, is one of the government's flagship financial-inclusion programmes.
According to the official PMJDY dashboard, the programme had approximately 59.49 crore bank accounts and ₹3.20 lakh crore in deposits as of 30 September 2026. The scale of account creation represents a substantial expansion of formal banking access.
For households previously excluded from banking services, an account can make it easier to receive government transfers and access other financial services.
However, the total number of accounts does not establish how many unique people became financially included for the first time. Nor does account ownership alone demonstrate regular use, access to affordable credit, protection against financial shocks or improved household income.
To assess the programme's wider impact, the investigation must examine account activity, direct benefit transfers, first-time banking access and the extent to which financial services have improved household security.
What the evidence establishes: Jan Dhan has expanded access to formal bank accounts on a substantial scale.
What remains to be established: How many people experienced lasting improvements in financial security as a result?
Source: Pradhan Mantri Jan Dhan Yojana official dashboard.
2. Poverty reduction: What do the headline figures measure?
Poverty reduction is one of the most significant claims made about India's development trajectory.
NITI Aayog's January 2024 discussion paper, Multidimensional Poverty in India Since 2005–06, estimated that India's multidimensional poverty headcount ratio declined from 29.17% in 2013–14 to 11.28% in 2022–23. It estimated that approximately 24.82 crore people moved out of multidimensional poverty during that period.
These figures require an important qualification: the estimates for 2013–14 and 2022–23 are projections based on survey data and extrapolation methods, rather than direct observations from two surveys conducted in those exact years.
Multidimensional poverty measures overlapping disadvantages involving health, education and living standards. It is not the same as monetary poverty, which examines whether household consumption or income falls below a defined threshold.
The World Bank's June 2025 update, using revised international poverty lines and updated consumption data, estimated that India's extreme-poverty rate declined from 16.2% in 2011–12 to 2.3% in 2022–23.
These estimates use a different methodology and reference period from NITI Aayog's multidimensional poverty measure. They must not be combined as if they were the same indicator.
The reductions reported by both sources are important findings. However, determining their causes requires further analysis. Economic growth, public services, welfare transfers, state-level programmes and changes in household consumption can all influence poverty outcomes.
The investigation must also examine people living just above poverty thresholds, differences between states and social groups, and whether improvements in consumption have kept pace with rising prices.
What the evidence establishes: Published estimates indicate substantial reductions in measured poverty under the respective methodologies.
What remains to be established: The precise distribution of these gains and the contribution of individual government policies to the reductions.
Sources: NITI Aayog and World Bank poverty estimates and methodology.
3. Employment: More people working, but in what conditions?
Employment is a central test of whether economic growth creates opportunities for ordinary citizens.
The Periodic Labour Force Survey (PLFS) reported that the worker-population ratio among people aged 15 and above increased from 46.8% in 2017–18 to 58.2% in 2023–24. The unemployment rate under the survey's usual-status measure declined from 6.0% to 3.2% over the same period.
These indicators suggest that a larger proportion of the population was classified as employed and that measured unemployment declined under the survey's definitions.
However, the figures refer to a specific historical comparison period. They should not be presented as the latest employment estimates, and they do not independently establish the quality of the jobs involved.
The worker-population ratio includes people classified as employed under the survey's methodology. It does not directly measure whether their jobs are permanent, adequately paid, productive or sufficient to support a household.
The unemployment rate measures unemployed people as a proportion of the labour force. It does not capture every person who wants more work, is underemployed or has stopped looking for employment.
A comprehensive assessment must therefore examine regular salaried employment, self-employment, unpaid family work, informal employment, wages adjusted for inflation, youth unemployment and women's access to paid work.
What the evidence establishes: Official survey indicators improved between 2017–18 and 2023–24.
What remains to be established: Whether the employment gains translated into sufficient, secure and adequately paid work across different sections of society.
Source: Ministry of Statistics and Programme Implementation.
4. Welfare schemes: Delivery is not the same as impact
The government highlights programmes such as PM Awas Yojana, Ujjwala, Jal Jeevan Mission, Ayushman Bharat, PM-KISAN and free foodgrain distribution as evidence that development has reached poorer households.
Each programme addresses a different need. Consequently, each requires a different measure of success.
For housing, the number of houses sanctioned must be distinguished from houses completed, occupied and supplied with essential amenities.
For LPG, the number of connections issued must be distinguished from regular refills and sustained use of clean cooking fuel.
For drinking water, a household connection must be distinguished from a functional tap, a reliable supply and water that meets quality standards.
For healthcare, the number of eligible or registered beneficiaries must be distinguished from patients who actually received treatment, the value of care provided and the expenditure genuinely avoided.
A Comptroller and Auditor General (CAG) performance audit of Ayushman Bharat–Pradhan Mantri Jan Arogya Yojana reported that 7.87 crore beneficiary households had been registered against an original target of 10.74 crore, according to National Health Authority records in November 2022. This represented approximately 73% of that historical target.
The comparison relates to the original target and reporting date. Subsequent expansion of the scheme means it cannot be used as a current coverage rate.
Similarly, the CAG's 2019 performance audit of the Ujjwala scheme examined implementation between May 2016 and December 2018, including issues relevant to sustained LPG use.
These audits provide evidence for examining implementation and monitoring. They do not, by themselves, establish that the entire schemes failed or that all beneficiaries experienced the same outcomes.
What the evidence establishes: Welfare programmes have expanded access to important services, while audits have identified implementation questions requiring scrutiny.
What remains to be established: The proportion of eligible people who received the full intended benefit, used the services consistently and experienced measurable improvements in their lives.
Sources: CAG of India.
5. Infrastructure and economic growth: What counts as development?
Roads, railways, airports, digital payments and manufacturing are prominent features of the government's development narrative.
These investments can produce real benefits, including shorter journeys, improved market access, more efficient logistics, business opportunities and better access to services.
However, infrastructure announcements must be distinguished from operational results. An assessment should examine whether projects were completed, whether they are being used, what they cost, whether they are safe and accessible, and how much maintenance they require.
Manufacturing claims also need careful examination. Investment announcements alone do not establish how much production has begun, how much value is created domestically, how many jobs are generated or whether exports have become more competitive.
Economic growth must likewise be examined alongside household living standards. Rising national GDP does not necessarily mean that every household has experienced a corresponding increase in purchasing power.
The 2023–24 Household Consumption Expenditure Survey estimated average monthly per-capita consumption expenditure at ₹4,122 in rural India and ₹6,996 in urban India, excluding the imputed value of free welfare items.
The survey also revealed substantial differences between expenditure groups. Average monthly per-capita expenditure was ₹1,677 for the bottom 5% of the rural population and ₹10,137 for the top 5%. In urban India, the corresponding figures were ₹2,376 and ₹20,310.
These figures illustrate differences in consumption levels, but they are nominal expenditure estimates for one survey year. They do not independently measure real income growth since 2014.
A reliable comparison requires compatible historical data, adjustment for price changes and attention to differences between households.
What the evidence establishes: Household consumption varies considerably across the population, and infrastructure and economic growth must be assessed alongside their distributional effects.
What remains to be established: How far national economic expansion has translated into improved purchasing power, better employment and more equitable access to development.
Source: Ministry of Statistics and Programme Implementation.
6. The marketing question: How accurately are achievements presented?
Government publicity is a normal part of public communication. The existence of publicity does not, on its own, establish exaggeration or deception.
The appropriate test is whether the headline accurately represents the underlying evidence.
For every major claim, this investigation will record the original statement, the speaker, the date, the baseline, the definition used and the source of the figure.
It will then examine whether the number represents an announcement, budget allocation, registration, benefit delivered, completed project or measurable outcome.
The investigation will also establish whether the figure counts unique individuals, households, accounts, projects or transactions. This distinction matters because the same person may receive several benefits, while a registered beneficiary may not necessarily receive the intended service.
For example, a statement that millions of households have been provided with a service may accurately describe the number of connections or registrations. It may nevertheless leave unanswered how regularly the service operates, whether it is affordable and whether it improves living standards.
The same standards will apply to criticism of the government. Opposition statements, allegations and media reports must also be checked against documentary evidence and reliable data.
The purpose is not to judge an achievement by the prominence of its publicity, but to examine whether the publicity reflects the scale, limitations and outcomes supported by the evidence.
7. What this first investigation establishes
The evidence reviewed for this opening article supports several observations.
First, the government has expanded major financial-inclusion and welfare programmes, and official figures document substantial reach in areas such as banking access.
Second, published estimates report significant reductions in measured poverty under specified methodologies. Official employment indicators also improved between 2017–18 and 2023–24.
Third, these findings do not, by themselves, establish the quality of employment, the distribution of economic gains, the full impact of welfare programmes or the proportion of every eligible household that benefited.
Fourth, independent audits have identified implementation and monitoring issues in specific programmes. Those findings deserve scrutiny, but must be applied to the relevant scheme, period and jurisdiction rather than generalised without evidence.
Finally, it would be methodologically unsound to attribute every change since 2014 exclusively to the Union government. State governments, earlier policies, private investment, demographic changes, international economic conditions and other factors also influence development outcomes.
This opening article is therefore a starting point, not a final verdict on 12 years of governance.
What comes next?
The second instalment, “Welfare for Millions: Who Actually Benefited?”, will examine PM Awas Yojana, Ujjwala, Jal Jeevan Mission, Ayushman Bharat, PM-KISAN and Jan Dhan.
The investigation will assess how many eligible people were reached, how many actually received the promised benefits, whether they could use the services effectively, and what reliable evidence shows about the results.
Where a defensible beneficiary percentage can be calculated, it will be published with its denominator, reporting date and source. Where the evidence is insufficient, that limitation will be stated openly.
The central question remains: When a government announces development for millions, how much can be verified—and how much can be demonstrated to have improved people's lives?
The Headline Prime Minister will seek to answer that question through evidence, documented scrutiny and transparent reporting.
Editorial note: Figures in this article refer to the dates, populations and methodologies specified by their sources. Government announcements, official survey estimates, audit findings and independent assessments of policy impact are different forms of evidence and should not be treated as interchangeable.
Series: The Headline Prime Minister | Part 1 of 7 | Dweep Tulika