
Sri Vijayapuram | Dweep Tulika News | 12 October 2026
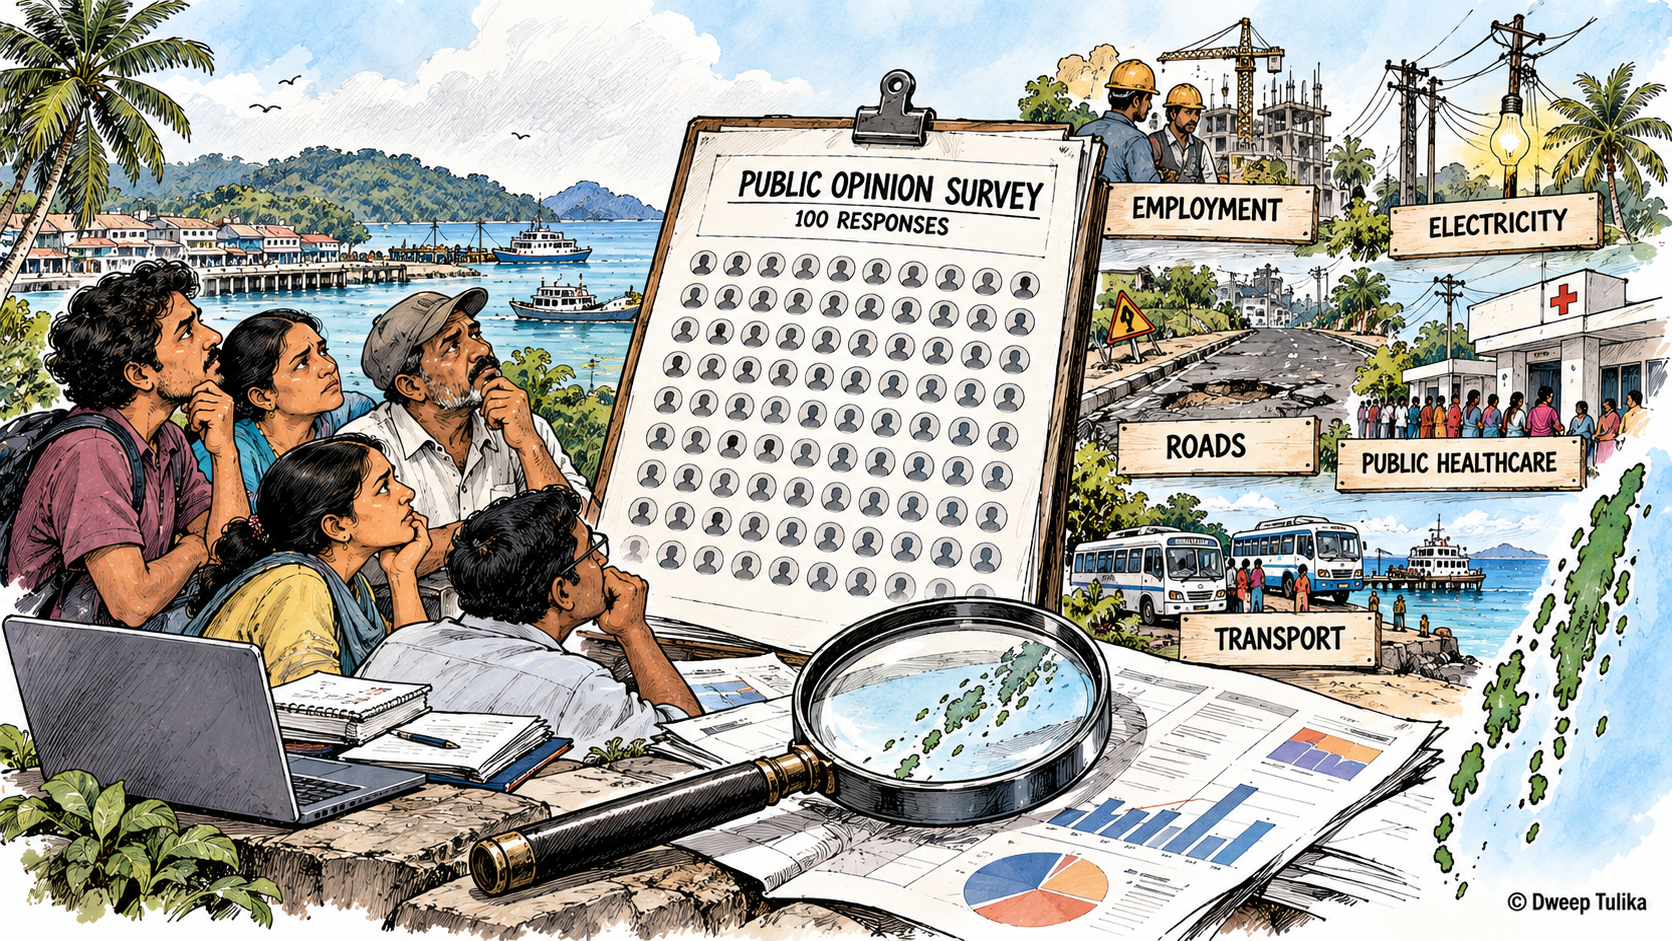
Employment emerged as the most frequently mentioned concern among respondents in Dweep Tulika's 2026 Public Opinion Survey, followed by healthcare, roads, drug abuse and youth opportunities. The findings also show low average satisfaction ratings for electricity, roads and government hospitals, alongside considerably weaker assessments of administration and grievance redressal than of overall quality of life.
The survey collected 100 responses between 9 July and 20 August 2026 through Google Forms, promoted on social media and through outreach at selected high-footfall public locations. The results provide a snapshot of the views expressed by the respondents; the sampling method does not establish that these views represent the entire population of the Andaman and Nicobar Islands.
Employment emerges as the leading concern
Employment was mentioned by 67 of the 100 respondents when asked about the biggest problems facing the islands. Healthcare was mentioned by 47 respondents, roads by 46, drug abuse by 41 and youth opportunities by 38.
Education was cited by 34 respondents, while corruption was mentioned by 31. Waste management and the cost of living were also prominent concerns, receiving 27 and 26 mentions respectively.
The ranking indicates that employment and livelihood opportunities occupy a central place in the concerns expressed by this group of respondents. The prominence of youth opportunities alongside employment also points to a related issue worth examining: the availability of suitable opportunities for young people in the islands.
When asked what should be the government's highest priority, employment again ranked first in the survey's categorised responses, accounting for 38 respondents. Healthcare followed with 20, education with 12 and infrastructure with 11.
The consistency between the two questions makes employment the clearest recurring theme in the survey. However, the responses measure what participants identified as priorities; they do not independently establish local unemployment rates or the number of jobs required.
Electricity, roads and government hospitals receive the lowest ratings
Respondents rated ten public-service categories on a five-point scale. Electricity recorded the lowest average rating at 1.84 out of 5, followed by roads at 1.96 and government hospitals at 2.11.
Electricity received ratings of 1 or 2 from 78% of respondents. Roads received ratings of 1 or 2 from 70%, while government hospitals received ratings in the same range from 64%.
Other services also received relatively modest scores. Ferry services averaged 2.41 out of 5, public transport 2.46, and law and order 2.48. Government schools and cleanliness each averaged 2.56.
Internet connectivity recorded the highest average among the ten categories, at 2.73 out of 5. Even this score remained below the midpoint of the scale.
These ratings reflect respondents' assessments rather than an independent technical audit of service quality. They identify areas where further investigation could examine service availability, reliability, infrastructure, staffing and public experience.
Quality of life scores higher than governance ratings
Overall satisfaction with quality of life in the islands averaged 3.12 out of 5. On this question, 36% of respondents gave a rating of 4 or 5, while 27% gave a rating of 1 or 2. The remaining 37% selected the middle rating of 3.
The picture was less positive when respondents assessed the administration.
Satisfaction with the administration averaged 2.23 out of 5. A total of 57% gave ratings of 1 or 2, while 12% gave ratings of 4 or 5. The remaining 31% selected a rating of 3.
The difference between the two measures is notable. Respondents' overall assessments of their quality of life were more favourable than their assessments of the administration.
This gap does not, by itself, establish why respondents hold these views. It does, however, suggest that public satisfaction with governance deserves separate examination rather than being inferred from general quality-of-life ratings alone.
Grievance redressal remains a concern
The question on government departments' response to public grievances produced an average score of 2.05 out of 5.
A combined 68% of respondents rated grievance response at 1 or 2, while 5% gave ratings of 4 or 5. The remaining 27% selected a rating of 3.
The findings indicate dissatisfaction with grievance redressal among many participants. They do not measure the number of complaints filed, departmental response times or the proportion of complaints resolved. Those questions would require administrative records and further reporting.
Respondents express reservations about elected representation
Satisfaction with the performance of elected representatives averaged 2.02 out of 5. A total of 68% rated performance at 1 or 2, compared with 10% who rated it at 4 or 5.
Respondents were also asked how accessible their elected representative was to the public. Thirty-eight per cent answered “Sometimes”, 24% “Rarely” and 20% “Never”. Sixteen per cent answered “Often”, while 2% answered “Always”.
Combined, 82% selected “Sometimes”, “Rarely” or “Never”. These responses indicate that many participants did not report consistently frequent access to their representative.
The survey does not establish the reasons for these responses, whether accessibility differs across constituencies or whether individual respondents had attempted to contact their representative. These are areas that could be explored through follow-up interviews and responses from elected representatives.
Direction of the islands: more respondents say no than yes
Asked whether they believed the islanders were moving in the right direction, 46% of respondents answered “No”, 34% said they were unsure and 20% answered “Yes”.
The negative response was therefore more than twice as common as the affirmative response in this sample. However, the 34% who were unsure should not be classified as respondents who believed the islands were moving in the wrong direction.
The result points to considerable uncertainty and a predominantly non-affirmative response to the question among those surveyed. It does not establish the opinion of the wider island population.
Who participated in the survey?
The sample was geographically concentrated in South Andaman. Of the 100 respondents, 86 were from South Andaman, 13 from North and Middle Andaman, and one from Nicobar.
The respondents were also relatively young. Forty-seven per cent were aged 18–24, while 28% were aged 25–34. Students accounted for 45% of the sample.
These characteristics matter when interpreting the findings. The results are particularly informative about the views expressed by this group of respondents, including its substantial younger and student component. They cannot automatically be generalised to older residents, other occupational groups or communities across all three districts.
Methodology and limitations
Dweep Tulika collected responses through a Google Forms questionnaire circulated on social media and through outreach at selected high-footfall public locations. Participation was voluntary.
The survey used a non-probability sampling approach combining online participation and public outreach. Respondents were not selected through a documented probability-based process in which every resident had a known chance of selection. The findings should therefore be treated as a descriptive public-opinion snapshot, not as a statistically representative estimate of public opinion across the Andaman and Nicobar Islands.
The survey's 100 responses allow the newsroom to describe the answers received and compare patterns within the sample. They do not justify a conventional population margin of error or population-wide estimates. The limited number of respondents from North and Middle Andaman and Nicobar also prevents meaningful district-level conclusions.
What the findings establish
Three broad patterns emerge from the responses.
First, employment is the most frequently identified problem and the leading categorised government priority. Second, electricity, roads and government hospitals receive the lowest average ratings among the ten public-service categories assessed. Third, satisfaction with administration, grievance redressal and elected-representative performance is lower than overall quality-of-life satisfaction.
These findings identify issues for further public-interest reporting. Establishing the scale and causes of these concerns would require additional evidence, including employment data, service-delivery records, complaint-resolution figures, district-level outreach and responses from the relevant authorities.
About this survey: Dweep Tulika Public Opinion Survey 2026 received 100 responses between 9 July and 20 August 2026. The figures in this report describe the respondents who participated and should not be interpreted as representative estimates for the entire island population.