
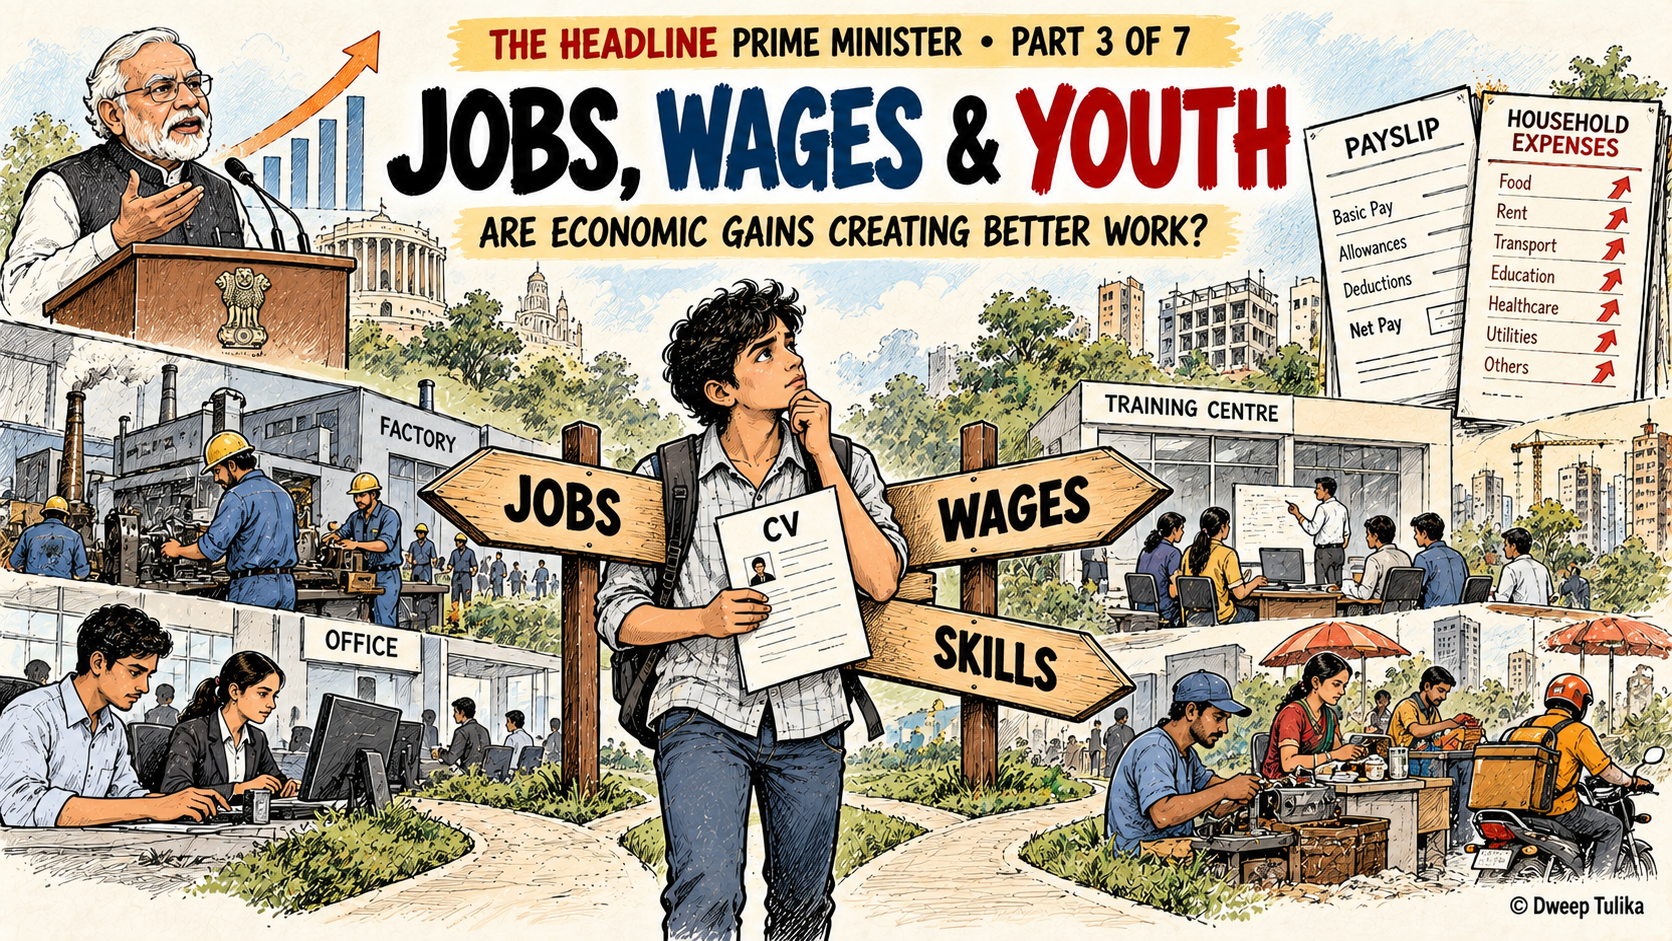
NEW DELHI | OCTOBER 20, 2026 | DWEEP TULIKA | NATIONAL
The Headline Prime Minister | Part 3 of 7
Employment, unemployment, salaries and opportunities for young Indians under 12 years of Narendra Modi’s leadership.
Introduction: A job is more than a number
Employment is one of the most important measures of a country’s economic progress. Growth becomes meaningful for ordinary families when it creates work that pays adequately, provides reasonable security and offers opportunities for advancement.
Since Narendra Modi became Prime Minister in May 2014, the Union government has promoted manufacturing, entrepreneurship, infrastructure investment, digital services, formalisation and skill development as ways to expand employment.
Official labour surveys report improvements in several employment indicators in recent years. Yet questions remain about the quality of work, wages, youth unemployment, women’s participation and the ability of educated young people to find jobs that match their qualifications.
To understand the employment record, it is necessary to examine both sides of the evidence.
The government’s Periodic Labour Force Survey (PLFS) provides estimates of employment, unemployment, wages and workforce participation. The International Labour Organization (ILO), together with the Institute for Human Development, has also examined India’s labour market, particularly the challenges faced by young people.
This investigation examines what these sources establish, what they leave unanswered and why the distinction between having work and having a decent job matters.
1. What do the latest official employment figures show?
The Ministry of Statistics and Programme Implementation released the Annual Report of the Periodic Labour Force Survey for 2025 in March 2026.
According to the figures cited in the report, the unemployment rate among people aged 15 and above under the usual-status measure was 3.1% in 2025. The labour force participation rate stood at 59.3%, while the worker-population ratio was 57.4%.
The report also recorded an increase in the share of workers in regular wage or salaried employment, from 22.4% in 2024 to 23.6% in 2025.
These figures provide evidence of changes in India’s labour market. However, they must be interpreted carefully.
The PLFS sampling design changed in January 2025, introducing a calendar-year reporting cycle and more frequent national estimates. The Ministry has cautioned that estimates under the revised design may not be strictly comparable with earlier annual reports.
The latest monthly bulletin provides a different measure. Under the current-weekly-status approach, the unemployment rate for people aged 15 and above stood at 5.0% in September 2026. This is not directly interchangeable with the annual usual-status rate of 3.1%.
What the figures establish: Official surveys report relatively low unemployment under the annual usual-status measure and an increase in the share of workers in regular salaried employment in 2025.
What they do not establish: Whether all additional employment is adequately paid, secure, full-time or sufficient to meet household needs.
2. Youth unemployment: The challenge is not over
Young people are central to India’s employment debate because millions enter the labour market every year.
The PLFS Annual Report 2025 estimated the unemployment rate among people aged 15–29 at 9.9%, down from 10.3% in 2024 under the usual-status measure.
The survey reported an unemployment rate of 8.3% among rural youth and 13.6% among urban youth in 2025. These estimates suggest an improvement compared with the previous year under the survey’s definitions, but the difference between rural and urban areas remains significant.
Another indicator deserves attention: the report estimated that 21% of people aged 15–24 and 25% of those aged 15–29 were not in employment, education or training under the usual-status measure.
This category, often called NEET, includes young people who are neither working nor studying or receiving training. It is not identical to unemployment. Some may be looking for work, while others may be outside the labour force because of family responsibilities, discouragement or other circumstances.
A young person who wants a suitable job may not be counted as unemployed if they are not actively seeking work.
The ILO’s India Employment Report 2024: Youth Employment, Education and Skills examined these challenges. It found that some labour-market indicators improved after 2019, while persistent problems remained involving job quality, educational qualifications and the transition from education to work.
The message is clear: reducing measured unemployment is only one part of the challenge. Young people also need productive work that matches their skills and offers a reasonable path to financial independence.
What the evidence establishes: The reported youth unemployment rate declined between 2024 and 2025, while a substantial proportion of young people remained outside employment, education or training.
What remains to be examined: Whether young Indians can find stable work matching their qualifications, and how opportunities differ by gender, education, region and family income.
3. More employment or better employment?
One of the central questions in evaluating the government’s employment record is the type of work being created.
The PLFS Annual Report 2025 estimated that 56.2% of workers were self-employed, 23.6% were in regular wage or salaried employment, and 20.2% were casual labourers.
Compared with 2024, the share of self-employed workers declined from 57.5%, while the share in regular wage or salaried employment increased from 22.4%.
These changes may indicate a shift in the composition of employment. But the category of self-employment covers a wide range of circumstances.
It includes employers and own-account workers, as well as people who help in household enterprises. Some self-employed people run successful businesses; others operate small activities with low or irregular earnings.
Regular salaried employment does not automatically guarantee high pay or good working conditions either. Contract terms, social security, working hours and income stability also matter.
The ILO’s 2024 report examined the rise in self-employment and unpaid family work during periods of economic disruption. Its analysis shows why the number of people classified as employed must be considered alongside the circumstances in which they work.
The issue is not whether self-employment is inherently good or bad. The question is whether people have access to productive work that provides sufficient and dependable earnings.
What the evidence establishes: Self-employment remained the largest employment category in the 2025 PLFS, although its share declined slightly while regular salaried employment increased.
What remains to be established: How many workers earn adequately, how many have social protection and how much of the shift represents improved opportunities rather than changes in how households make a living.
4. Wages: Are earnings keeping pace with the cost of living?
Employment figures cannot tell the full story without examining wages.
The PLFS Annual Report 2025 recorded increases in average nominal earnings between 2024 and 2025 across several employment categories. Among regular wage or salaried workers, average monthly earnings increased from ₹22,891 to ₹24,217 for men and from ₹17,126 to ₹18,353 for women.
For self-employed workers, the corresponding averages increased from ₹16,893 to ₹17,914 for men and from ₹5,861 to ₹6,374 for women.
Among casual labourers outside public works, average daily earnings were reported at ₹455 for men and ₹315 for women in 2025, compared with ₹456 and ₹299 respectively in 2024.
These are nominal earnings: the amounts received in rupees, without adjustment for changes in prices.
If wages rise while food, housing, transport, healthcare and education become more expensive, the improvement in purchasing power may be smaller than the nominal increase suggests.
The figures also show differences between men and women. In regular salaried work, average earnings for women remained below the corresponding average for men. Self-employment displayed a particularly large difference in the reported monthly averages.
These comparisons do not establish the reasons for the gaps by themselves. Occupation, hours worked, industry, experience and employment arrangements may contribute. A fuller analysis would also examine pay for comparable work.
The next step is to compare wage growth with inflation over a consistent period and to examine earnings across income groups, sectors and regions.
What the evidence establishes: Average nominal earnings increased in several categories between 2024 and 2025, while differences between men and women remained.
What remains to be established: How much real purchasing power improved, how earnings are distributed within each category and whether workers can meet the rising costs of essential goods and services.
5. Women and employment: Participation is not the same as opportunity
Women’s participation in the labour market is another important measure of economic inclusion.
The PLFS Annual Report 2025 estimated the labour force participation rate for women aged 15 and above at 40.0% under the usual-status measure, compared with 79.1% for men.
The worker-population ratio for women stood at 38.8%, compared with 76.6% for men.
The survey also found that 44.4% of women outside the labour force cited childcare or personal commitments in homemaking as their main reason for not participating.
These figures point to the importance of examining the barriers that influence whether women can enter and remain in paid work.
Childcare responsibilities, access to safe transport, workplace conditions, skills, local job availability and social expectations can all affect employment choices.
A rise in women’s participation can be an important development. But the type of work matters. Paid employment, unpaid family work, self-employment and irregular casual work have different implications for financial independence.
The reported difference in average earnings between men and women also warrants further examination. National averages cannot establish the reasons for that gap, but they provide a basis for investigating occupational segregation, working hours, career progression and remuneration.
What the evidence establishes: Women’s participation and employment remained substantially below men’s under the 2025 usual-status measures.
What remains to be established: How much of women’s work provides independent earnings, secure employment and access to social protection, and what barriers prevent more women from obtaining suitable work.
6. Manufacturing, skills and the promise of new jobs
The government has promoted manufacturing, infrastructure, digital services, startups and skill development as important routes to employment generation.
The PLFS Annual Report 2025 recorded an increase in manufacturing’s share of employment, from 11.6% in 2024 to 12.1% in 2025. Agriculture’s share declined from 44.8% to 43.0% over the same period.
These figures indicate a change in the distribution of employment across sectors during the period measured. They do not, by themselves, establish how many new jobs were created because of a particular policy, or whether those jobs offered adequate wages and security.
A comprehensive assessment of manufacturing-led employment must consider domestic value addition, productivity, exports, the number and quality of jobs created, and whether smaller businesses and suppliers benefit.
Skill development requires similar scrutiny. Training enrolment and certificates are outputs; the relevant outcomes are whether participants find work, whether that work matches their training and whether their earnings improve.
The PLFS Annual Report 2025 estimated that 5.0% of people aged 15–29 had received formal vocational or technical training. This indicator does not cover every form of informal learning, but it highlights the importance of examining the reach of formal training and the transition from training to employment.
What the evidence establishes: Manufacturing’s share of employment increased modestly in the 2025 survey, while agriculture’s share declined.
What remains to be established: How much employment growth can be linked to particular industrial and training policies, and whether the resulting jobs offer durable opportunities for workers.
7. What can we conclude about 12 years of employment policy?
The evidence does not support a simple conclusion based on one unemployment figure.
Official surveys show improvements in several recent employment indicators, including lower measured youth unemployment between 2024 and 2025 and a modest increase in the share of workers in regular salaried employment.
At the same time, the data show that self-employment remains the largest employment category, the proportion of young people outside employment, education or training is substantial, and women’s participation remains far below men’s.
Nominal earnings have increased across several categories, but those increases must be assessed against inflation before conclusions can be drawn about purchasing power. The 2025 survey’s revised methodology also limits direct comparisons with some earlier annual estimates.
These findings do not prove that employment policy has failed. Nor do they establish that the government’s employment initiatives alone caused the improvements recorded in the surveys.
Employment outcomes depend on economic growth, private investment, technological change, education, demographic trends, global conditions and policies adopted by both the Union and state governments.
A complete assessment of the Modi government’s record therefore requires a longer view of employment trends, consistent wage comparisons and evidence on the outcomes of specific policies.
Conclusion: The question is not just whether people are working
For a young graduate, the question may be whether suitable work is available. For a rural worker, it may be whether earnings cover household expenses. For a woman, it may be whether employment is compatible with family responsibilities and provides financial independence. For a self-employed person, it may be whether income is regular enough to support a family.
National employment indicators are essential, but they cannot answer every one of these questions.
The evidence reviewed here shows that India’s labour market has experienced changes in participation, employment composition and nominal earnings. It also identifies continuing questions about youth opportunities, women’s participation, informal work, wage adequacy and job quality.
The next stage of the investigation must connect these indicators to the policies intended to influence them. That means examining recruitment records, employment programmes, manufacturing outcomes, training results and inflation-adjusted earnings.
The central question remains: Are India’s economic gains creating enough secure, productive and adequately paid work for the people who need it?
The Headline Prime Minister will continue to examine that question through official records, independent research and transparent comparisons.
Series: The Headline Prime Minister | Part 3 of 7 | Dweep Tulika Editorial
Editorial note: This article uses the PLFS Annual Report 2025 and the ILO’s India Employment Report 2024. The PLFS methodology changed in January 2025, limiting direct comparability with some earlier annual estimates. Figures should be read according to the population, employment-status definition and reporting period specified by each source.